Next, the KPIs section defines measurable success at each stage of the Flywheel. Refer to the area highlighted in green below:
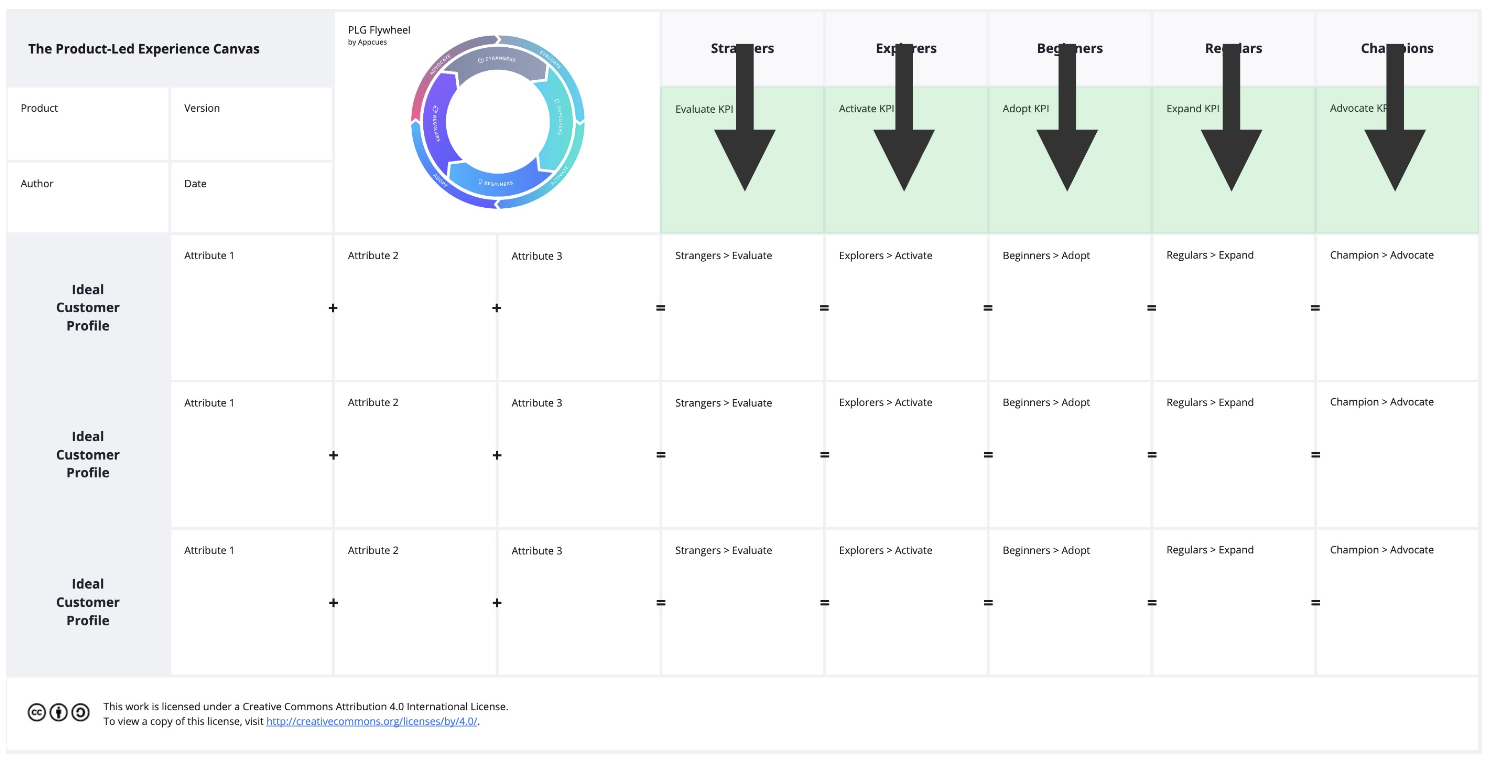
FIG. 1 — THE KPI SECTION OF THE PLX CANVAS · PLG FLYWHEEL BY APPCUES · CC BY 4.0
These metrics help track how well your product is guiding users through the five key actions of the adoption process.
Remember that we want Strangers to Evaluate, Explorers to Activate, Beginners to Adopt, Regulars to Expand, and Champions to Advocate. For example:
EvaluateVisit 2nd web page, stay on site for 1 min, browse 3+ product pages
ActivateRegister an account, start free trial, make 1st purchase
AdoptPurchase subscription, make repeat purchases
ExpandUpgrade subscription, buy team plan, purchase new category
AdvocateRefer a friend, invite co-worker, rate on App Store
Tip: As a designer, you must collaborate with stakeholders to choose the key actions that best fit your product and context. Then, link each action to specific KPIs that you can monitor and refine. Depending on your product, you may need to create new KPIs or use existing ones.
Here's an example of some KPIs with quantifiable targets included:
EvaluateEngagement Rate: aim for 70% or higher, indicating users are actively interacting with your content or product. Time on Site: target an average of at least 3 minutes, ensuring users spend sufficient time exploring your offerings.
ActivateActivation Rate: set a goal of 60% or above—users taking the first key step, like signing up or starting a free trial. Conversion Rate: strive for 20% or more, moving from a trial or free tier to a paid plan.
AdoptRetention Rate: aim for 80% or higher, ensuring a large majority of users continue using the product over time. Repurchase Rate: target 50% or above—users coming back for repeat purchases or renewals.
ExpandUpsell Rate: set a goal of 25% or more—existing customers upgrading to higher-tier plans or additional services. Feature Adoption Rate: aim for 40% or higher for key features, ensuring users take advantage of the product's full capabilities.
AdvocateReferral Rate: target 15% or above, with a notable portion of satisfied customers referring new users. Review and Rating Score: strive for 4.5 stars or higher, reflecting positive feedback and high satisfaction.
Note: These KPIs are essential for both product development and continuous improvement. For instance, if your goal is to improve the Activation Rate, you might track how many users who start a free trial go on to make their first purchase.
With an ICP and a KPI for each stage, you have two of the three ingredients for a well-formed design challenge. The final section shows how to combine them into How Might We statements — the Elements row of the Canvas.